Usage Guide
Pairwise Meta-Analysis
How to run pairwise meta-analysis
1
Create a project and outcome
- 1Click "New Project" and name your review
- 2Add an outcome (e.g. "Mortality", "Pain Score")
- 3Choose the outcome type (binary or continuous) and effect measure (OR, RR, MD, SMD)
2
Upload your data
- 1Click "Upload Data" and select your CSV or Excel file
- 2Columns are auto-detected — the system recognises 100+ column name variants
- 3Map columns to roles: Study ID, Events, Total, Mean, SD, Sample Size, etc.
- 4Confirm the mapping — data is transformed and validated
Tip: Wide format (one row per study with intervention and control columns) or long format (one row per arm) are both supported.
3
Run the analysis
- 1Click "Run Analysis"
- 2R computes the pooled effect using your chosen model (fixed or random effects)
- 3Results include: pooled estimate, confidence interval, I², tau², Q statistic
4
View results
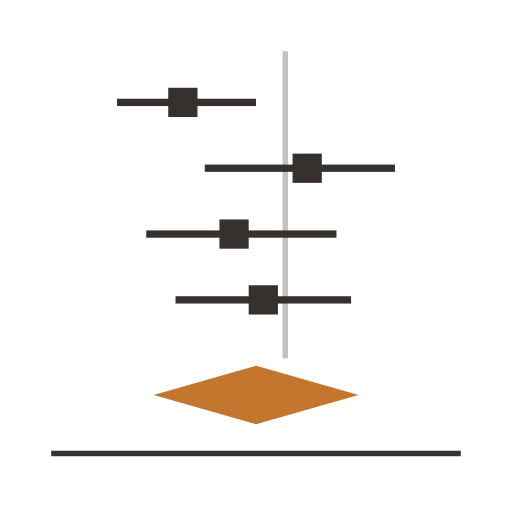
- 1Forest plot with study weights and confidence intervals
- 2Funnel plot for publication bias assessment
- 3Subgroup analysis (if covariates are mapped)
- 4Download plots as PNG or export data